

Why gpu usage drops when fps drops is one of the most confusing problems in PC gaming, and the short answer is simple: your graphics card is waiting on something else. A GPU only works as hard as the frames it is asked to draw. When the frame rate falls and GPU usage falls with it, the card is not broken. Something earlier in the chain, the CPU, a frame cap, full video memory, heat, a power limit, the game engine, background software, or a bad driver, is setting the pace, and the GPU finishes its share of each frame early and then idles until the next frame is ready.
That sounds backwards, and that is why so many players waste money on the wrong fix. They see low GPU usage, assume the card is weak, and start shopping for a new one. In most cases the card is fine. The real problem is upstream, and it is usually free to fix. This guide walks you through the problem as a decision tree. Each branch is one cause, and each branch ends with one test you can run in a few minutes. Follow the branches in order, and you will know exactly what is holding your frame rate back before you spend a dollar.
Low GPU usage plus low FPS means your GPU is starved of work, not worn out. The most common cause is a CPU limit, often on a single core, followed by a frame cap or VSync, full VRAM, thermal throttling, and a power limit. Check your per-core CPU load first. If one core is near 100 percent while total CPU usage looks low, the CPU is the limit. If your frame rate sits flat on a round number such as 60 or 144, a cap is the limit. If GPU temperature climbs into the 80s Celsius and clocks fall, heat is the limit. Run one test per branch, change one thing at a time, and retest in the same scene.
What GPU Usage Actually Measures
GPU usage, also called GPU utilization, is the percentage of time the graphics card spends busy over a short window. A reading of 99 percent means the card is working almost constantly. A reading of 50 percent means it spends about half its time waiting. That waiting time is the clue. A healthy gaming PC with a demanding game and no frame cap usually shows GPU usage between 95 and 100 percent, because the card is the part setting the pace. That is the ideal state, and it is the one number most guides get right.
What most guides get wrong is treating the percentage as a grade for the card. It is not. It is a measure of how much work the card is being given. A powerful card running an old or light game at 1080p can sit at 40 percent usage while delivering 200 frames per second, and nothing is wrong. The same 40 percent reading becomes a real problem only when the frame rate is also low, because then the card has spare capacity that something is preventing it from using. Always read GPU usage next to FPS. The pair tells the story. Either number alone can mislead you.
There is a second number that matters just as much, and most players never look at it: GPU power draw, measured in watts. Usage and power draw are not the same thing. A card can show high usage while drawing little power if its clocks are low, and it can show low usage while drawing normal power in short bursts. When you diagnose a problem, watch both. If usage is low and power draw is far below the card’s rated board power, the card is genuinely idle and waiting. If usage is low but power draw is normal or high, the card may be working in bursts between stalls, which points toward memory, storage, or engine stalls rather than a simple CPU limit. Free tools such as HWiNFO64 show both numbers side by side, and that pair is worth more than either number alone.
Frame time is the third number that turns guessing into diagnosis. Frame time is how long one frame takes to produce, measured in milliseconds. At 60 FPS each frame takes about 16.7 milliseconds. At 120 FPS each frame takes about 8.3 milliseconds. At 144 FPS each frame takes about 6.9 milliseconds. Average FPS hides stutter, because a game can average 60 FPS while half its frames take 30 milliseconds and half take 5. Frame time shows those spikes. If you want a deeper explanation of why frame time matters more than the FPS number on the box, our guide to what frame time is and why 1% lows matter breaks it down in plain language.
Total CPU Percentage vs Per-Core Saturation
Here is the single most misunderstood fact in PC performance troubleshooting. A CPU can be the bottleneck while Task Manager shows total CPU usage at only 35 or 40 percent. That happens because games do not spread their most important work evenly across every core. Most games have one main thread that does the heavy serial work: game logic, draw call preparation, AI decisions, and telling the GPU what to draw next. That thread can only run on one core at a time. If that one core is maxed out, the whole frame pipeline stalls, no matter how idle the other seven or fifteen cores are.
Total CPU percentage averages the load across all cores, so one saturated core disappears into the average. An 8-core CPU with one core at 100 percent and seven cores at 20 percent shows about 30 percent total usage. The screen says the CPU is relaxed. The reality is that one core is the wall your frame rate is hitting. This is the trap that sends players down the wrong path: they look at 30 percent CPU usage, conclude the CPU is fine, and blame the GPU, the drivers, or the game.
The fix is to look at per-core usage, not the total. In Task Manager, open the Performance tab, click CPU, right-click the graph, and choose Change graph to, then Logical processors. Now you can see every core separately. Play your game for a few minutes and watch. If one or two cores sit near 90 to 100 percent while the GPU sits at 50 or 60 percent, you have found a per-core CPU limit. The same check works in MSI Afterburner with the on-screen display, which can show each core as its own line while you play. HWiNFO64 shows the same data in more detail.
There is a related trap on the GPU side. GPU usage can read near 100 percent while the card is actually throttled, because the card is busy at reduced clock speeds. That is why you should always check GPU clock speed and temperature alongside usage. A card at 99 percent usage but running hundreds of megahertz below its normal boost clock is not delivering full performance. It is working hard at a slower speed, usually because of heat or a power limit. The branches below cover both cases, and each one tells you exactly which numbers to watch.
How to Read Your Numbers in 60 Seconds
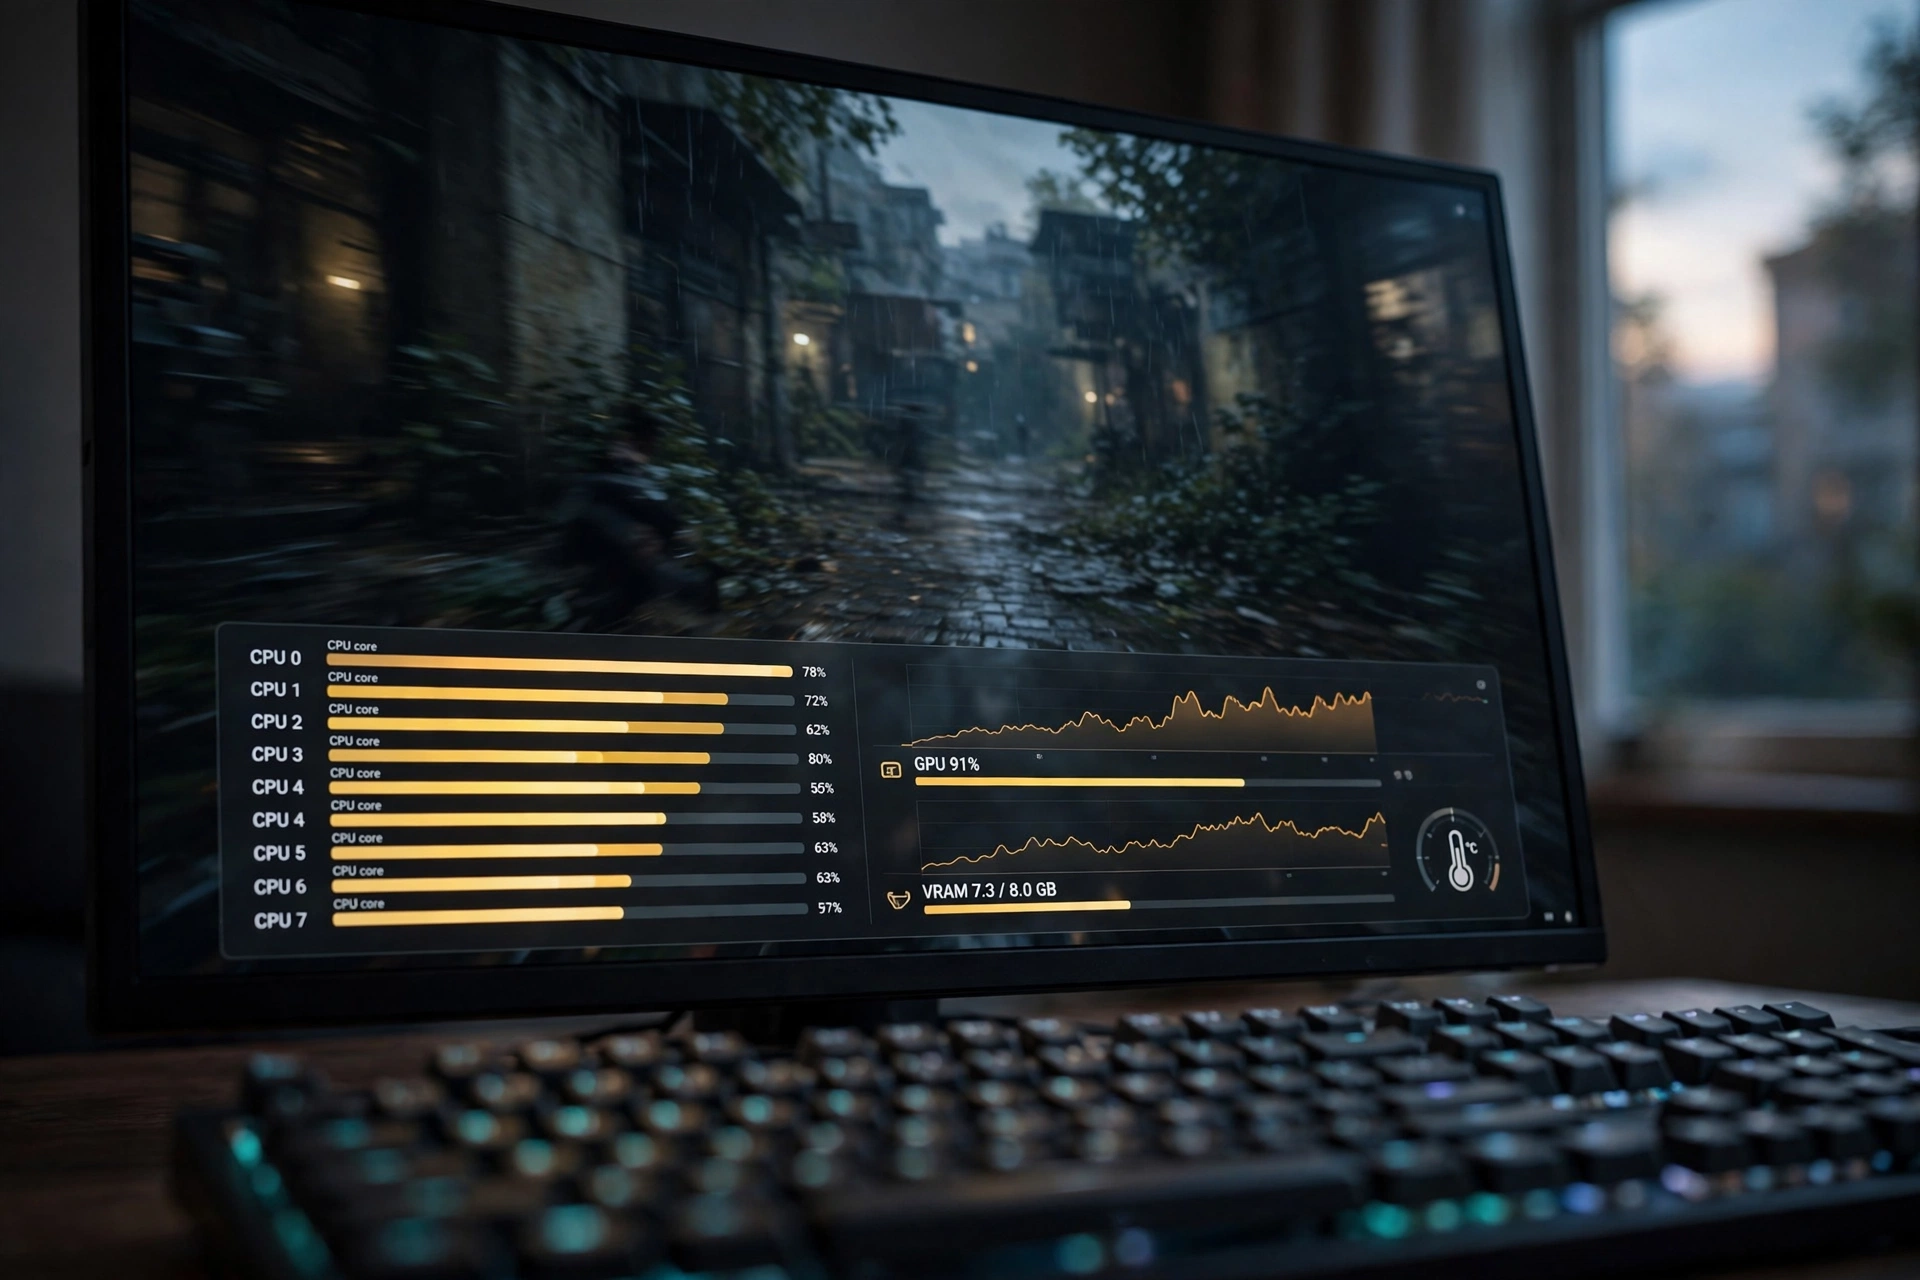
Before you change anything, spend one minute setting up a proper reading. Guessing from a single Task Manager glance is how players misdiagnose this problem for weeks. You need five numbers on screen at the same time while you play: FPS, GPU usage, GPU temperature, GPU clock speed, and CPU usage per core. Two more numbers help a lot: VRAM usage and GPU power draw. One repeatable test scene matters as much as the tools. Pick a busy spot in your game, save there, and use the same spot for every test. A quiet corridor and a crowded city fight are not comparable, and comparing them will lie to you.
MSI Afterburner with RivaTuner Statistics Server is the most common free way to show these numbers as an overlay while you play. HWiNFO64 shows even more detail, including per-core CPU load, VRAM usage, GPU power draw, and whether the card is reporting a thermal or power limit. Task Manager on its own can show GPU usage, GPU temperature, and per-core CPU graphs, which is enough for the first pass. Use whichever tool you already have, but use the same tool for every test so your readings stay comparable.
Write down a baseline before you touch any setting. Play your test scene for 60 seconds and note the average FPS, the GPU usage, the hottest CPU core, the GPU temperature, and the GPU clock speed. That baseline is your before picture. Every fix you try gets measured against it in the same scene. If a change does not move the baseline, undo it and try the next branch. Changing three settings at once and then guessing which one helped is the most common way to waste an evening.
The Diagnosis Table Match Your Symptom to the Cause
Use this table to find your branch fast. Find the row that matches what you see on screen, then jump to that branch for the full test and fix.
| Symptom | Likely Cause | Quick Test |
|---|---|---|
| One CPU core near 100 percent, GPU below 80 percent | Per-core CPU limit | Lower resolution one step, FPS barely changes |
| FPS stuck exactly at 60, 120, or 144 | Frame cap or VSync | Turn off all caps and VSync, watch FPS |
| VRAM usage at or above your card’s total VRAM | VRAM full, textures spilling to system RAM | Lower texture quality one step, watch stutter |
| GPU temperature above 83 Celsius, clocks falling | Thermal throttling | Open the case side panel, watch temperature and FPS |
| GPU power draw far below rated board power | Power limit or weak PSU delivery | Check power connectors and power plan |
| Drops only in one game or one area | Engine or game limit | Test a second game in the same scene style |
| Drops start when another app is open | Background software stealing CPU | Close all background apps, retest |
| GPU usage swings from 100 percent to 0 percent | Driver or firmware issue | Clean driver reinstall, then test again |
| FPS fine at first, then falls after 10 minutes | Heat soak or power limit over time | Log temperature and clock speed over 15 minutes |
If your symptom matches more than one row, start with the row at the top of the list. CPU limits and frame caps cover most cases, and they are the cheapest to test.
A Single CPU Core Is the Limit
This is the most common branch, and it is the one the per-core check above is built to catch. Your CPU prepares each frame before the GPU can draw it. It runs the game logic, the physics, the AI, and the draw calls that tell the GPU what to render. When the main thread hits the limit of a single core, the GPU gets its work late. It draws the frame quickly, then waits. Usage falls. FPS falls. The GPU looks lazy, but it is actually waiting for instructions.
This pattern shows up most at 1080p and in CPU-heavy games: open-world titles with lots of NPCs, strategy games, simulation games, and competitive shooters running at very high frame rates. It also shows up when a strong GPU is paired with an older or weaker CPU. The pairing itself is not a defect, but the combination means the CPU sets the ceiling in lighter scenes while the GPU sets it in heavier ones. If you want to check whether your own pairing is balanced before you blame one part, our guide on how to find a PC bottleneck walks through the same per-core test step by step.
The test for this branch is the resolution test. Play your test scene at your normal settings and note the FPS. Then drop the resolution one step, for example from 1440p to 1080p, or lower the render scale to 70 percent, and play the same scene again. If the FPS barely changes, the GPU was not the limit, because making the GPU’s job much easier did not make the game faster. The CPU, or a cap, is the ceiling. If the FPS jumps up sharply and GPU usage climbs toward 95 percent, the GPU was the limit, and this branch is not your problem.
If the CPU is the limit, start with the free fixes before you think about a new processor. First, make sure your RAM is running at its rated speed. Memory running at slow default speeds can starve a CPU, and the fix is enabling XMP on Intel boards or EXPO on AMD boards in the BIOS. Second, check that your RAM is running in dual channel, which means two sticks in the correct slots, not one stick or two sticks in the wrong slots. Single-channel memory can cost real frame rate in CPU-limited games. Third, lower the settings that cost CPU time rather than GPU time: view distance, crowd density, shadow quality in some engines, and physics detail. Lowering texture quality or resolution will not help a CPU limit, and it can actually make GPU usage look even lower, which confuses the diagnosis.
If those steps do not move the needle, the honest answer is that the CPU is the ceiling for that game at those settings, and the real fix is a faster CPU or accepting the frame rate you have. Upscalers such as DLSS and FSR can help in GPU-limited scenes, but they do not fix a CPU limit, because they make the GPU’s job easier while the CPU still has to prepare every frame. The same is true of the newer DLSS 5 features and the NVIDIA App DLSS Override option, which lets you use a newer upscaler model in supported games. Those are genuinely useful when the GPU is the limit, and they are part of why upscaling keeps improving, but they cannot create CPU headroom that does not exist. Do not buy a new graphics card to fix a CPU limit. The GPU usage number will stay low, because the new card will wait just like the old one did.
A Frame Cap or VSync Is Holding You Back
This branch is the good news branch, because it means nothing is wrong at all. A frame cap is a setting that tells the game to stop at a certain frame rate, usually 30, 60, 120, or 144 FPS. VSync does the same thing by locking the frame rate to your monitor’s refresh rate. When a cap is active and your GPU is fast enough to exceed it, the card finishes each frame early and waits for the next one. Usage falls to whatever percentage is needed to hold the cap. FPS falls to the cap number and stays there, flat and steady.
The signature of this branch is a frame rate that sits exactly on a round number and never moves. 60.0 FPS in a quiet scene and 60.0 FPS in a busy fight is not a coincidence. It is a cap. Check every place a cap can hide: the in-game frame rate limit, VSync in the game settings, VSync or Max Frame Rate in the NVIDIA Control Panel or AMD Software, a frame limit in the NVIDIA App or AMD Software, and a refresh rate limit in Windows display settings. A monitor left at 60 Hz in Windows will also hold you at 60 FPS with VSync on, even if the monitor itself supports 144 Hz. Check the Windows display settings first if you recently changed monitors.
The test is simple. Turn off VSync and every frame limit, then play the same scene again. If the FPS jumps up and GPU usage climbs, the cap was the cause, and your hardware was fine all along. You can then decide whether to keep a cap on purpose. Many players cap their frame rate slightly below the monitor’s refresh rate on purpose to keep frame times smooth and the card cooler and quieter. That is a legitimate choice. A capped 60 FPS on a 60 Hz monitor with 40 percent GPU usage is not a problem to fix. It is a system working exactly as asked.
One exception matters here. If you turn off every cap and the FPS stays low while GPU usage stays low, the cap was not the cause. Move on to Branch 1. Caps and CPU limits can look alike at a glance, because both produce low GPU usage, but the flat round-number FPS is the tell for a cap, and the saturated CPU core is the tell for a CPU limit.
VRAM Is Full and Textures Are Spilling to System RAM
VRAM is the fast memory on your graphics card that holds textures, frame buffers, and geometry data. When a game needs more VRAM than the card has, the extra data spills over to system RAM, which is far slower to reach from the GPU. The card stalls while it waits for textures to arrive, usage drops in bursts, and the game stutters, especially when you turn quickly, enter a new area, or load a busy scene. The average FPS might look acceptable while the 1 percent lows collapse, which is why this problem feels worse than the FPS number suggests.
The signature of this branch is stutter tied to movement and new scenery, with VRAM usage sitting at or above the card’s total capacity. An 8 GB card showing 7.9 GB of VRAM used in a modern game at high texture settings is running on the edge. A 12 GB card showing 11.8 GB used is in the same place. Watch VRAM usage in HWiNFO64 or MSI Afterburner during the stutter, not in a menu. Menus use little VRAM and will lie to you.
The test is to lower texture quality one step, from Ultra to High or High to Medium, and replay the same scene. Textures are the biggest VRAM consumer by far, and lowering them is the fastest way to confirm a VRAM problem. If the stutter clears and the frame time graph smooths out, VRAM was the cause. Lowering resolution alone is a weaker test, because resolution mainly affects the frame buffer, not the texture pool, and many players lower resolution first and conclude VRAM is not the problem when nothing changes.
If VRAM is the cause, keep texture quality at the level your card can hold, and close the gap with an upscaler. DLSS, FSR, and XeSS render at a lower internal resolution, which also reduces the frame buffer and some memory pressure, and they can recover real frame rate when the GPU is the limit. Ray tracing deserves a mention here too. Ray traced lighting and reflections add memory pressure, and older ray tracing implementations were heavy on VRAM. Newer DirectX Raytracing updates have cut ray tracing memory use in supported games, which is one reason keeping your drivers and game updates current matters: the same scene can use less VRAM after an update than it did at launch. If a game still exceeds your VRAM after those steps, the honest fix is lower settings, not a settings tweak that pretends the problem away.
Heat Is Forcing Your GPU to Slow Down
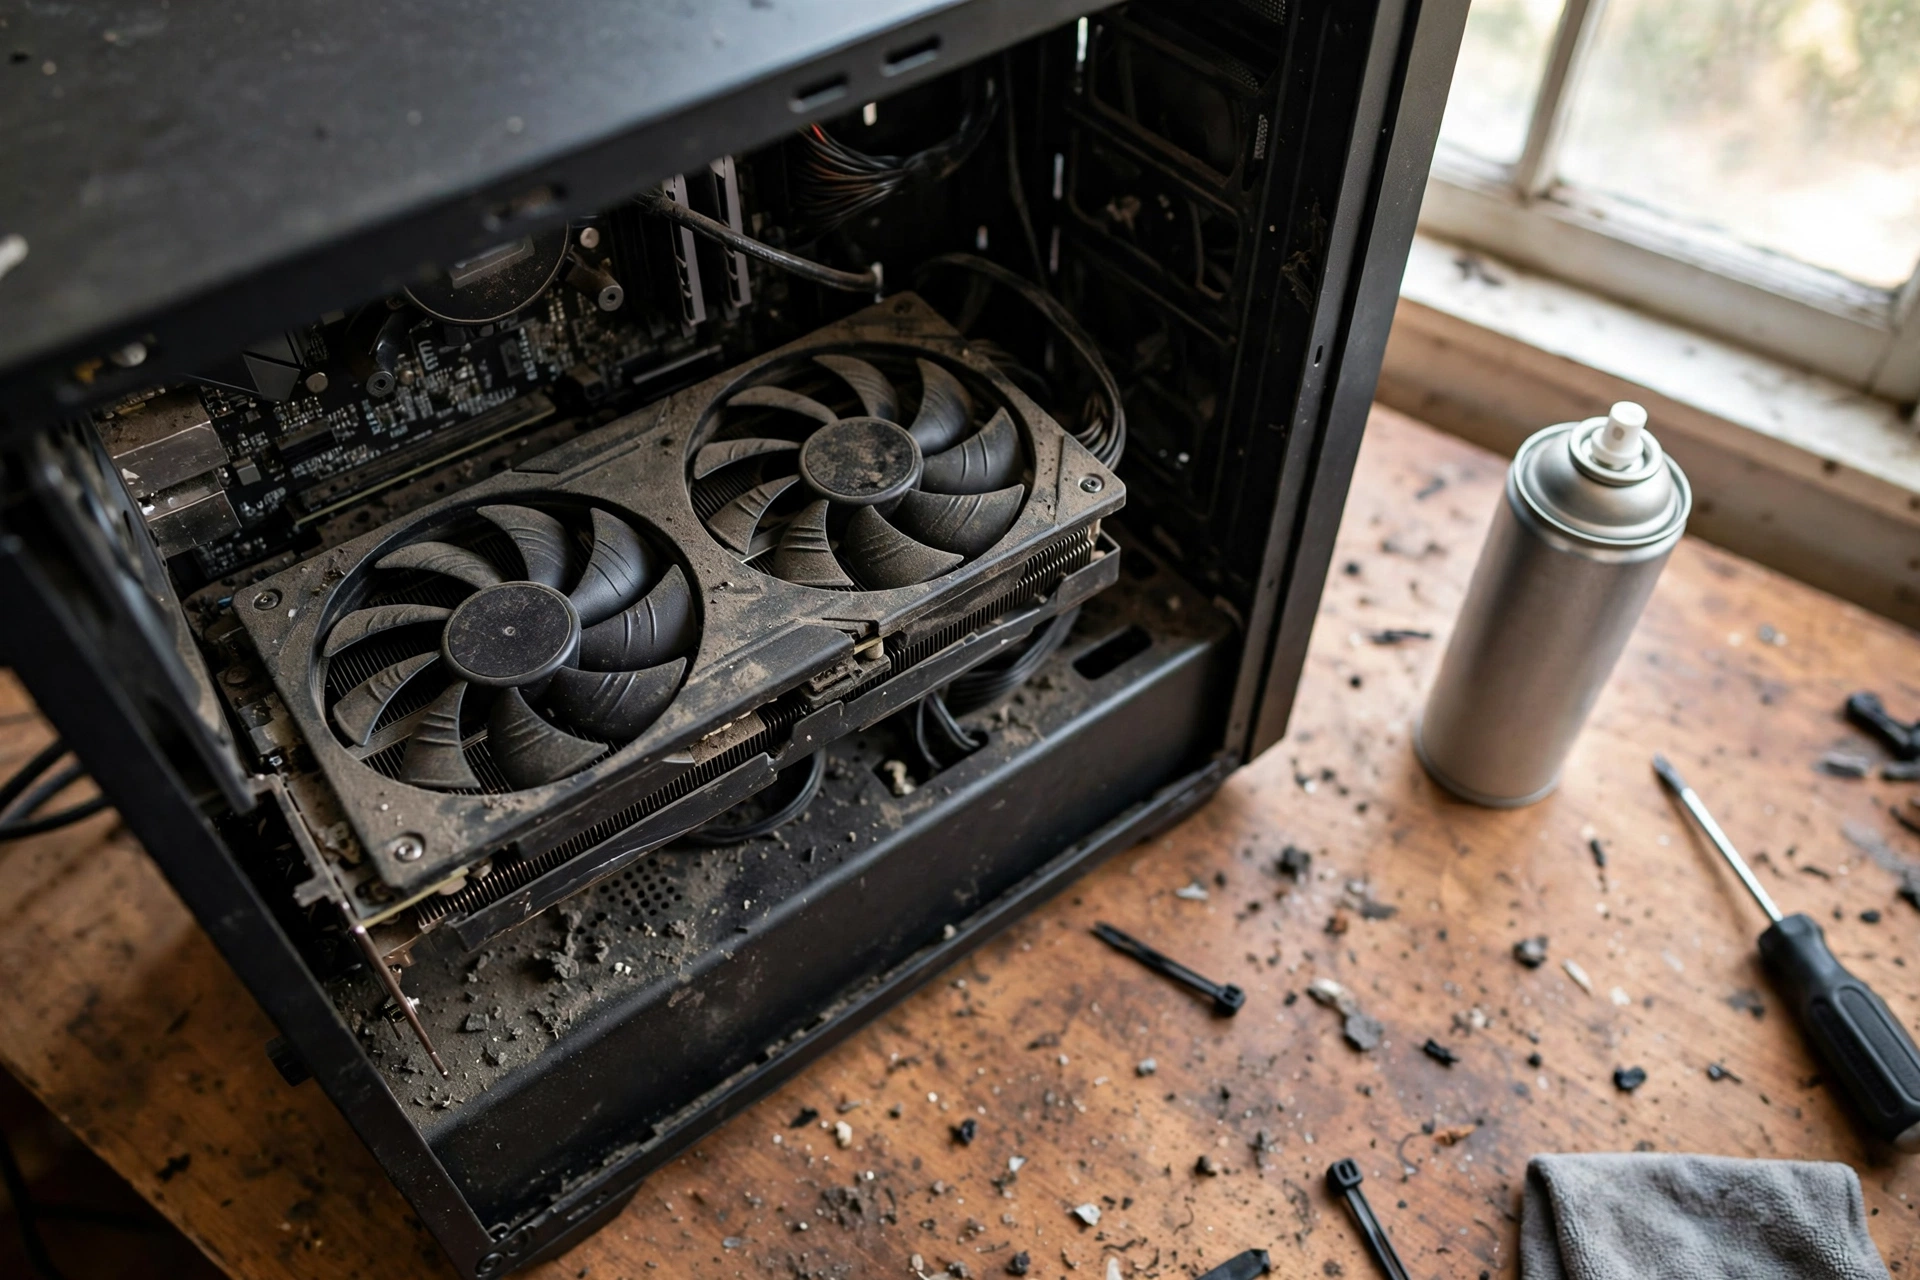
Heat is the branch that gets worse the longer you play. A game starts smooth, then after five or fifteen minutes the frame rate sags, GPU usage falls, and the fans get loud. That pattern is thermal throttling. Modern GPUs protect themselves by reducing clock speed when they get too hot. Lower clocks mean less work per second, which means lower FPS, and the usage number falls because the card is doing less in each window of time.
Many GPUs begin to reduce boost clocks in the low to mid 80s Celsius, and the exact point varies by model and manufacturer. There is no single safe temperature that applies to every card, so check your own card’s behavior instead of memorizing a number. The test is to watch GPU temperature and GPU clock speed together during a long session. If the temperature climbs steadily and the clock speed falls at the same moment the FPS drops, you have confirmed thermal throttling. HWiNFO64 can log both numbers over time, which makes the pattern easy to see.
The fixes start with the free ones. Open the case and check for dust on the GPU fans, the heatsink fins, and the intake filters. Dust is the most common cause of a slow thermal decline in a PC that used to run fine. Make sure the case fans are actually spinning and that intake and exhaust are not fighting each other. A quick test is to remove the side panel and replay the same scene. If temperatures drop several degrees and the FPS recovers, airflow is the problem, not the card. Check that the GPU fans are spinning under load, and check that no cable is blocking airflow across the card.
Laptops deserve a special note here. A laptop GPU shares a small cooling system with the CPU, and it will throttle sooner than a desktop card. Make sure the laptop is plugged in, set the Windows power mode to Best performance, and keep the vents clear. Raising the back of the laptop slightly so air can reach the intake vents is a simple step that helps more than most people expect. If the laptop is a few years old and the problem appeared gradually, dried thermal paste and dust in the heatsink are the usual suspects, and a professional cleaning is worth the cost.
If cleaning and airflow do not fix it, do not jump to replacing the card. A card that throttles at reasonable room temperature with clean fans and good airflow may have a failing fan or dried thermal paste, and both are repairable. A new card in the same hot case will throttle the same way, so fix the cooling first.
A Power Limit Is Starving the Card
A graphics card can only draw as much power as its power limit and its power supply allow. When the card hits its power limit, it reduces clock speed to stay inside the limit, and FPS falls with it. This branch looks a lot like thermal throttling on the surface, but the temperature is normal. The tell is GPU power draw: if the card is drawing far less power than its rated board power while the game is demanding, something is holding it back. A card rated for 200 watts that draws 110 watts during a heavy scene is not working at full power.
The test starts with the simple physical checks. Make sure the power connectors are fully seated in the card, and that you are using separate PCIe power cables from the power supply rather than a single cable split across two connectors on a high-power card. A loose connector or a daisy-chained cable can limit the power the card receives. Then check the Windows power plan. In Windows 11, go to Settings, then System, then Power and battery, and set Power mode to Best performance. The Balanced plan can hold back the CPU, which starves the GPU, and on laptops it can limit the GPU directly.
If those checks pass, look at the card’s own power limit in MSI Afterburner. Some cards ship with a conservative power limit, and raising it slightly, if your power supply and cooling can handle it, can recover lost performance. This is an advanced step, and it only helps if the card is genuinely power limited rather than thermally limited. Watch temperatures while you test, and stop if they climb. A power supply that is too weak for the card is a different problem: the system may crash or restart under load rather than throttle gracefully. If your PC restarts during heavy gaming, suspect the power supply before you suspect the card, and do not keep pushing it.
GPU prices have surged in late 2026, which makes this branch worth taking seriously before you shop. A new card will not fix a power delivery problem, and it will cost far more than a cable check, a power plan change, or a power supply that actually matches the card. Diagnose first, spend second.
The Game Engine or the Game Itself Is the Limit
Sometimes the limit is not your hardware at all. It is the game. Some engines are single-threaded in their core loop, some games cap their own frame rate internally, and some games have areas or scenes that are badly optimized. A game that runs at 200 FPS in one area and 70 FPS in another on the same hardware is often showing you an engine limit, not a hardware failure. Older games, console ports, and simulation-heavy titles are the usual cases.
The test for this branch is to play a second, different game in a similar style and compare. If the second game runs well with high GPU usage and the first game does not, the first game is the problem. Also check whether the drops happen in the same place every time. A drop that always happens when you enter the same town square or the same crowded market is an engine or scene problem. A drop that happens everywhere is more likely a hardware or settings problem.
There is a specific version of this branch worth knowing about: shader compilation stutter. When a game loads a new area or a new effect for the first time, it compiles shaders, and the game can hitch while that happens. The FPS drops, GPU usage drops to near zero for a moment, and then everything recovers. The second run through the same area is usually smooth. That pattern is normal on a first playthrough after a driver update or a game update, and it settles by itself. If the stutter never settles, the game may have a deeper problem, and the fix is usually a game patch, not a hardware change.
When the game is the limit, the practical fixes are narrow: lower the CPU-heavy settings for that game, check the game’s forums for a known issue, and make sure the game is updated. Do not rebuild your PC to fix one game’s bad optimization. If you play mostly one game and it is engine limited, the money is better spent on the part that game actually needs, which the per-core test in Branch 1 will tell you.
Background Software Is Stealing Your CPU
Your game does not run alone. Every program in the background takes a slice of CPU time, and on a CPU-limited system that slice comes straight out of your frame rate. The usual suspects are browsers with many tabs open, Discord overlays, RGB control software, hardware monitoring tools, screen recording software, Windows Update running in the background, and antivirus scans. A browser tab playing video can cost several percent of CPU time, and on a system where one core is already the limit, that is enough to drop FPS and GPU usage together.
The test is the simplest one in this guide. Close everything you do not need, including the browser, and replay the same scene. If the FPS recovers and GPU usage climbs, a background program was the cause. Then reopen your programs one at a time until the problem returns. That tells you which one is responsible. Recording and streaming software deserves a check of its own: recording with software encoding uses CPU time, while hardware encoding on the GPU uses very little. If you stream, use your GPU’s hardware encoder, NVENC on NVIDIA cards or the equivalent on AMD and Intel cards, so the recording does not compete with the game for CPU time.
Overlays are a smaller but real factor. The Discord overlay, the Steam overlay, and the NVIDIA App overlay each cost a little CPU time. On a fast system the cost is invisible. On a CPU-limited system it is measurable. Turn overlays off one at a time and retest. If you find the culprit, keep it off while you play and turn it back on when you are done.
Driver or Firmware Issues
Drivers are the last branch, not the first, because most driver problems look different from a hardware limit. The signature of a driver problem is abrupt: GPU usage swings from 100 percent to 0 percent and back, the game freezes for a second and then recovers, or the problem appeared suddenly after a driver update or a Windows update. A steady low GPU usage that has been there for months is rarely a driver problem. A sudden change is.
Intel’s own support guidance for abrupt GPU usage drops during gaming points to updating the graphics driver and the system BIOS, and that is good advice for all three GPU makers, not just Intel. Start with a clean driver install. Download the latest driver from the manufacturer’s own site, choose the custom install option, and check the clean install box. For NVIDIA cards, that page is the official NVIDIA driver download. For AMD cards, use AMD support to find the right driver for your card. A clean install removes old driver files that can conflict with the new ones, and it is worth the extra two minutes.
If the clean install does not help, try the previous driver version. A new driver can introduce a regression in a specific game, and rolling back one version is a legitimate test, not a defeat. If the problem started after a BIOS update or a Windows update, check the motherboard manufacturer’s site for a newer BIOS, and check the game’s forums for reports of the same problem after the same update. A problem that many players report at the same time is usually a driver or game issue, not your hardware.
One more check belongs in this branch: make sure the monitor is plugged into the graphics card, not the motherboard. On a desktop, the graphics card ports are lower down on the back of the case. If the monitor is plugged into the motherboard, the game may be running on integrated graphics, and the dedicated card will sit idle. On a laptop, check the Windows graphics settings and set the game to High performance so Windows sends it to the dedicated GPU instead of the integrated one. This mistake is common after moving a PC or cleaning a desk, and it produces exactly the symptom this article is about: low GPU usage and low FPS.
What Not to Do
Most of the money wasted on this problem comes from fixing the wrong thing. Do not lower your graphics settings first. Lowering resolution and texture quality reduces the GPU’s workload, which makes GPU usage fall even further and leaves a CPU limit untouched. That is the opposite of a fix. Lower settings only after you know which part is the limit.
Do not buy a new graphics card until you have run the branches above. A new card will not fix a CPU limit, a frame cap, full VRAM in the same game, a hot case, or a weak power supply. It will wait idle just like the old card, and with GPU prices surging in late 2026, that mistake is more expensive than it used to be. Spend the money on the part the tests point to, or spend nothing at all.
Do not change five settings at once. Change one thing, retest in the same scene, and write down the result. If you change the power plan, the driver, the resolution, and the texture quality in one go, you will never know which change helped, and you may keep a change that hurt. Slow, single-variable testing is boring, and it is the only method that actually works.
Do not trust a single monitoring tool blindly. Task Manager, MSI Afterburner, and HWiNFO64 can disagree on GPU usage by a few percent because they sample at different rates. A brief dip to zero in one tool can be a sampling gap, not a real problem. Look for patterns that last seconds and repeat, not single-frame blips. If you want a broader guide to raising frame rate once you know the cause, our article on how to increase FPS covers the settings that matter and the ones that do not.
Frequently Asked Questions
Why is GPU usage high and CPU usage low when playing a game?
This is the normal, healthy pattern, and it is the opposite of the problem in this article. High GPU usage with low CPU usage means the GPU is the part setting the pace, which is what you want in a demanding game. The CPU finishes its work quickly and waits for the GPU. You should only worry when the pattern flips: low GPU usage with low FPS. That combination means something else is holding the frame rate back, and the branches above will tell you what it is. This question comes from Quora, where players ask it often because the two patterns look similar at a glance.
Why is my CPU usage 100% if I play games?
Total CPU usage at 100 percent while gaming usually means the CPU is the limit for that game, and it is the clearest version of the Branch 1 problem. The game needs more CPU time than the processor can give, so the GPU waits. Check the per-core view first, because a single saturated core can push total usage high on a four-core CPU while hiding on an eight-core one. Close background programs, enable XMP or EXPO for your RAM, and lower CPU-heavy settings such as view distance and crowd density. If total CPU usage stays at 100 percent after those steps, the CPU is the ceiling for that game. This question comes from Quora, where it is one of the most asked performance questions.
Why does my GPU usage drop to 0% for a second during a game?
Short drops to zero are a different pattern from steady low usage, and they usually point to a driver issue, a shader compilation hitch, or the game loading new assets. Intel’s support guidance for abrupt drops recommends updating the graphics driver and the system BIOS, and a clean driver reinstall is the right first step. If the drop happens only when you enter a new area and the second run through the same area is smooth, it is shader compilation or asset streaming, and it settles by itself. If it happens constantly in the same game after a clean driver install, test a second game. If only one game does it, the game or its driver profile is the problem. This question is based on a real thread on the Tom’s Hardware forum titled “GPU Usage drops to 0% one time a game.”
I have a GTX 1080 and an i7-8700K and my GPU usage drops and FPS drops randomly. What is wrong?
This is a real problem reported on the Tom’s Hardware forum, and the answer there is a useful lesson. The player had only 8 GB of system RAM, and modern games at 1080p can use more than 9 GB. When system RAM runs out, the PC uses the much slower storage drive as overflow, and the frame rate collapses in stutters. The fix in that case was more RAM, not a new GPU. The lesson is general: check your system RAM usage during the drops. If it is at or near your total installed RAM, you are running out of memory, and no graphics setting will fix it. Close background programs first, and if the problem persists, adding RAM is the real fix.
Should I switch to a 144Hz monitor if I keep getting FPS drops?
No, a faster monitor will not fix FPS drops. A monitor only displays the frames your PC produces. If your PC struggles to reach 75 FPS now, a 144 Hz monitor will show the same drops, and it may make the stutter more obvious because the display is capable of smoother motion than the PC is delivering. Diagnose the drops first using the branches in this article. Once your frame rate is stable and above your current monitor’s refresh rate, then a faster monitor becomes worth the money. This question comes from Quora, where a player with a Ryzen 5 2600 and a GTX 1650 on a 75 Hz monitor asked exactly this.
Is low GPU usage bad?
Low GPU usage is bad only when your FPS is also lower than you want. If your frame rate is at or above your monitor’s refresh rate and the game feels smooth, low usage is normal and even good: the card runs cooler, quieter, and uses less power. It becomes a problem when the game stutters, the frame rate falls below your target, and the card still has spare capacity. Read the two numbers together, and use the diagnosis table at the top of this guide to find your branch.
What GPU usage should I aim for while gaming?
In a demanding game with no frame cap, aim for 95 to 100 percent GPU usage, because that means the graphics card is the part setting the pace and nothing is holding it back. Between 80 and 95 percent is usually fine, and it often means a light CPU limit or a frame cap nearby. Below 80 percent with low FPS means something is wrong, and the branches in this guide will help you find it. Below 50 percent with low FPS means the problem is severe, and you should work through the branches in order rather than guessing. If you are still unsure whether the problem is the CPU or the GPU after running these tests, our guide on why your FPS is so low covers the full range of causes with the same test-first approach.
Conclusion
Why gpu usage drops when fps drops has one answer and eight possible causes. The answer is that your GPU is waiting on something else. The causes are a per-core CPU limit, a frame cap or VSync, full VRAM, heat, a power limit, the game engine, background software, or a driver issue. Each one has a signature you can see on screen, and each one has a single test that confirms it in minutes.
Start with the per-core CPU check, because it is the most common cause and the one most guides miss. Then check for a frame cap, because it is the fastest test and the best possible news. Work through VRAM, heat, and power before you spend money, and remember that usage and power draw are different numbers that tell you different things. Change one setting at a time, retest in the same scene, and trust the numbers over your guess.
Most players who work through this decision tree find the problem in under an hour, and most of the fixes cost nothing. The card you already own is usually fine. It is just waiting for the rest of your PC to catch up, and now you know how to find out what is holding it back. If you want a reference for how your card compares to others before you decide on any upgrade, the Tom’s Hardware GPU hierarchy is a useful, regularly updated comparison of current graphics cards.

Leave a Reply