

You pick a processor, you pick a graphics card, you click a button, and a number appears on the screen. It might say 4 percent, or 15 percent, or 32 percent. It might say CPU Limited, GPU Limited, or Balanced. That is helpful, but only if you know what the number really means. A bottleneck calculator is a planning tool. It does not run a game on your PC. It does not watch your temperatures or your drivers. It compares your parts against benchmark data, it weighs your resolution and your workload, and it gives you an estimate of which part is holding the other back.
This guide opens that black box in plain English. You will learn how the engine works step by step, what each result means, how to read your score, and what to do next. You will also learn what the calculator cannot tell you, so you do not spend money on the wrong upgrade. If you are new to this topic, start with our guide to the types of PC bottlenecks. It explains the main kinds of limits in a gaming PC, and it will make the rest of this article even easier to follow.
What Is a Bottleneck Calculator?
A bottleneck calculator is a free online tool that checks whether your CPU and GPU work well together. You enter your processor, your graphics card, your RAM, and your screen resolution. You also pick what you do most, such as gaming, streaming, or editing. The tool then tells you which part is the weak link, and by roughly how much.
Think of your PC like a team. The CPU prepares each frame. It handles game logic, physics, draw calls, and the work that tells the graphics card what to draw. The GPU draws each frame. It handles textures, lighting, shadows, and the pixels on your screen. If one part works much faster than the other, the fast part has to wait. That waiting time is wasted power, and it can show up as stutter, low frame rates, or uneven play.
A bottleneck is not a broken part. It is an imbalance. A strong graphics card with a weak processor can still play games, but the card will sit idle while it waits for new frames. A strong processor with a weak graphics card can still run a game, but the card will hit its limit while the processor has spare room. A bottleneck calculator helps you spot that imbalance before you buy, before you upgrade, and before you blame the wrong part.
The best time to use one is before you spend money. If you are building a new PC, use it to check a few pairings and pick a balanced set. If you are upgrading one part, use it to see if that part will actually help, or if another part will still hold you back. If your games already stutter, use it as a first check, then confirm what you see with real play.
You can try the tool on our homepage and test your own CPU and GPU pairing in seconds, with no registration required.
How a Bottleneck Calculator Works
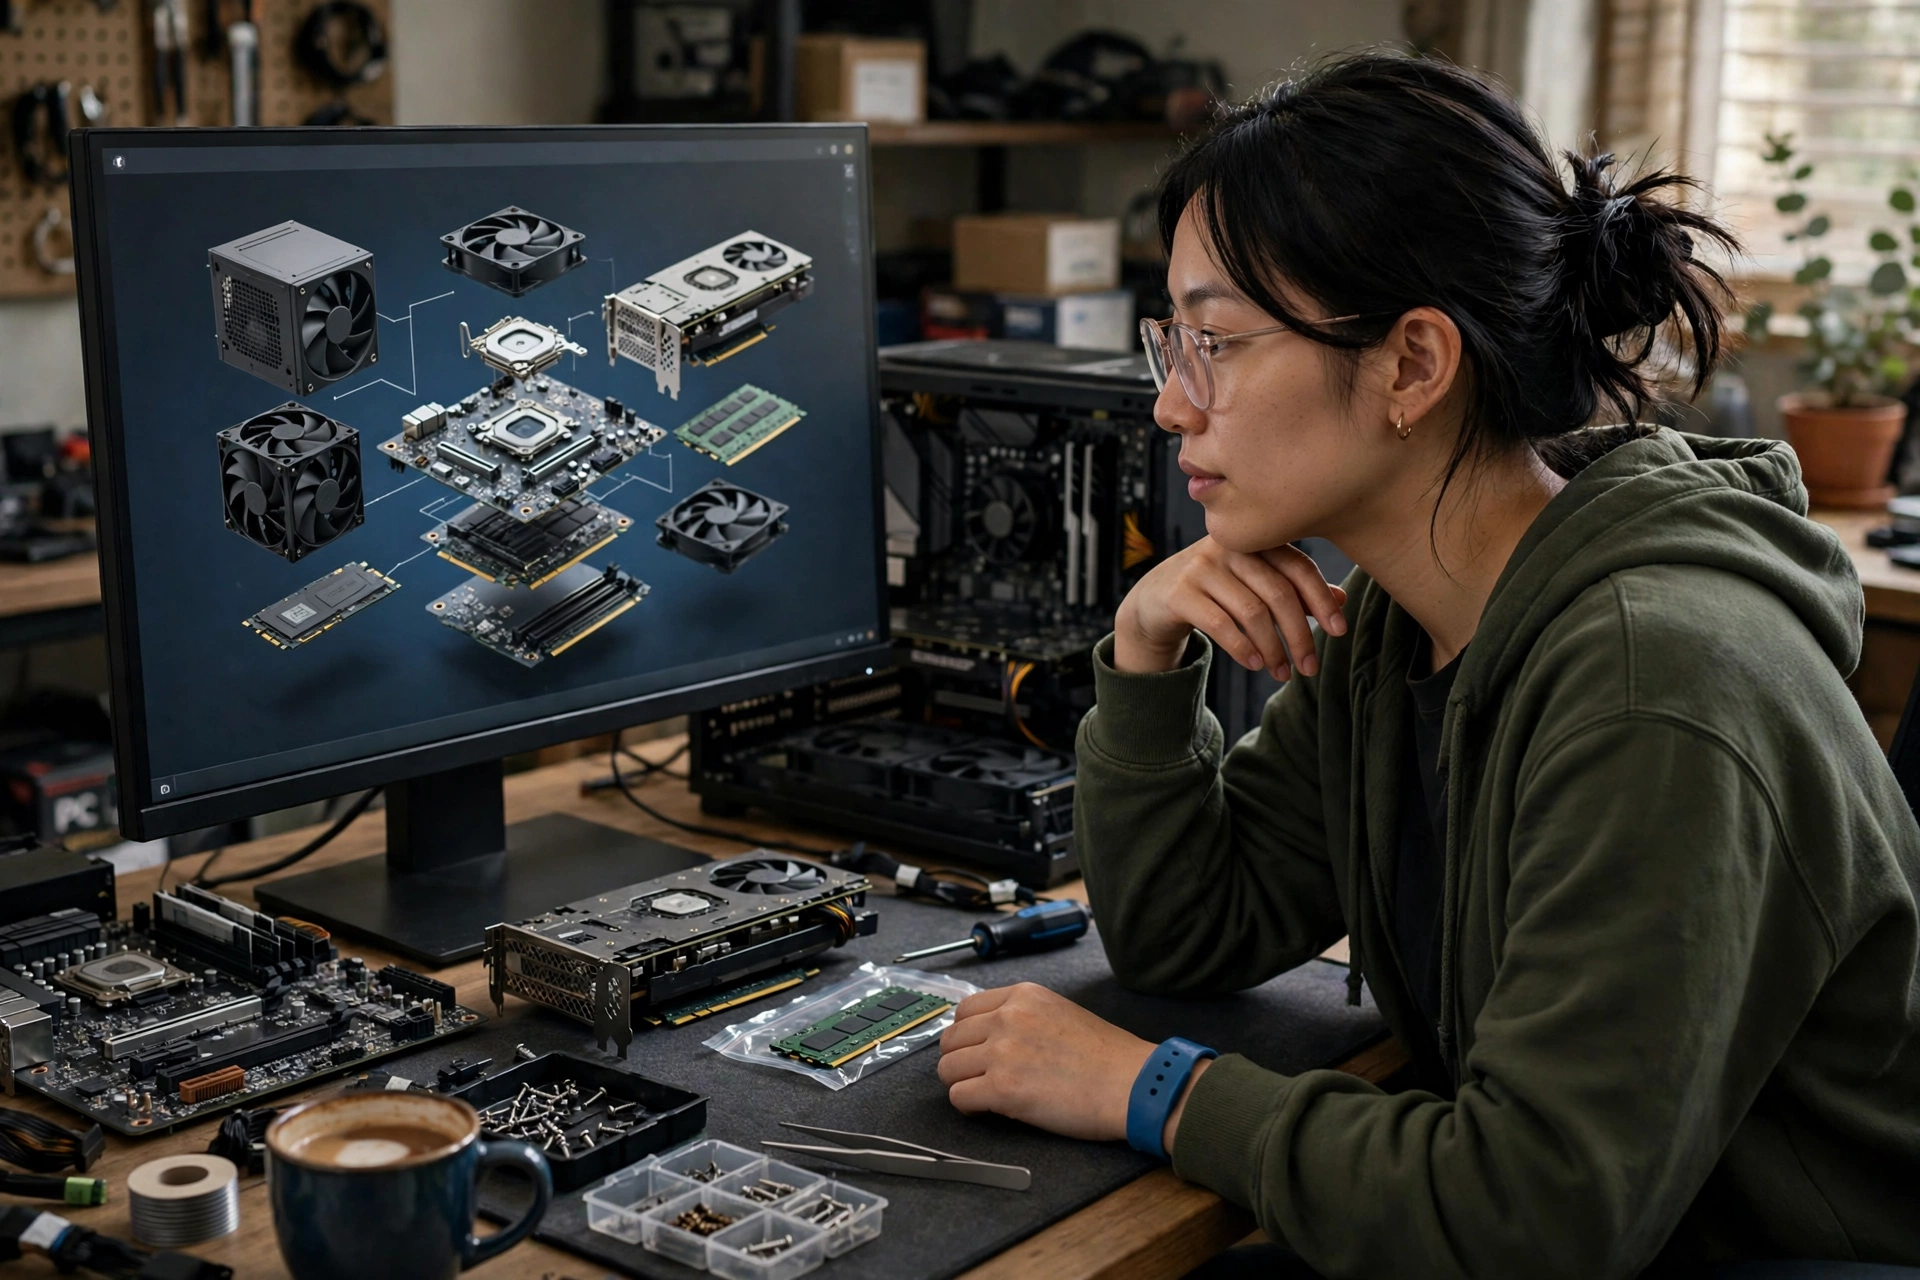
The calculator looks simple on the outside, but it does a lot of work behind the scenes. It does not guess. It follows a clear process, and each step adds a piece of the picture. Here is how that process works in our tool.
Step 1: It Looks Up Your Parts in a Hardware Database
The first step is a lookup. The engine analyzes your specific hardware combination against a database of hundreds of real world processors and graphics cards. That database holds the key facts for each part, such as its clock speeds, its core count, and its place in the current product range.
This matters because a name alone does not tell the full story. Two processors can share a brand name and still perform very differently. Two graphics cards can look close on paper and still behave very differently in games. The database gives the calculator a fair starting point for every part, from older budget chips to the newest flagship cards.
The database is updated as new hardware ships, so modern processors and graphics cards are covered alongside older parts that are still in use today. That is why the tool can compare a new card with an old CPU, or a new CPU with an old card, and still give a useful answer.
The current database covers the newest hardware too. That includes NVIDIA GeForce RTX 50 series cards, AMD Radeon RX 9000 series cards, AMD Ryzen 9000 processors, and Intel Core Ultra 200S processors. The GeForce RTX 5090, the current flagship card, launched on January 30, 2025. The Radeon RX 9070 XT launched on March 6, 2025. The Ryzen 7 9800X3D, a gaming focused chip with stacked cache, launched on November 7, 2024. Intel Core Ultra 200S desktop processors reached stores on October 24, 2024. When you enter one of these parts, the calculator is working from current benchmark data, not from a guess based on an older card with a similar name.
Step 2: It Checks Independent Benchmark Data
Next, the calculator checks independent benchmark data from trusted sources like PassMark and TechPowerUp. These sources test hardware in a careful, repeatable way, and they publish scores that other people can check.
Benchmark data matters because it is based on measured performance, not on marketing claims. A box can say a part is fast, but a benchmark shows how it actually performs in a test. The calculator uses those scores to place your CPU and your GPU on a fair scale, so it can compare them in a useful way.
No single benchmark tells the whole story, which is why the tool uses more than one source where it can. A CPU that is strong in one test may be weaker in another. A GPU that is strong at one resolution may be less strong at another. By using trusted benchmark data, the calculator avoids a simple guess and gives you an estimate that is grounded in real tests.
If you want to dig deeper into benchmark charts yourself, Tom’s Hardware publishes clear GPU and CPU hierarchies that show how parts rank against each other. Those charts are a good second check after you get your calculator result.
Step 3: Algorithm Factors Check How Each Part Really Performs
A raw benchmark score is a good start, but it is not enough on its own. The calculator also runs a set of algorithm factors that check how each part really performs in real work.
Those factors include clock speeds, core counts, IPC, memory bandwidth, memory latency, and GPU compute capacity. Each one is checked against real workload models, which are simple models of what a game, a stream, or an edit actually asks a PC to do.
Clock speed tells you how fast a part can work in each cycle. Core count tells you how many jobs it can handle at once. IPC, which stands for instructions per clock, tells you how much work it can finish in each cycle. A part with high IPC can do more work at the same clock speed than a part with low IPC, so clock speed alone would give you the wrong answer.
Memory bandwidth tells you how fast data can move to and from memory. Memory latency tells you how long that data takes to arrive. GPU compute capacity tells you how much raw drawing and math power the graphics card has. Together, these factors give a fuller picture than a single score ever could.
This step is what turns a simple comparison into a useful estimate. It helps the calculator tell the difference between a CPU that is fast in short bursts and a CPU that stays fast in a long gaming session, and between a GPU that is strong in raw power and a GPU that is held back by slow memory.
Step 4: GPU Normalization Puts Every Graphics Card on One Scale
Graphics cards come from different years, different brands, and different price ranges. To compare them fairly, the calculator uses GPU normalization.
In simple terms, GPU scores are scaled relative to the strongest current card set at 100 percent. The fastest card today sits at the top of the scale. Every other card is placed below it, based on how its benchmark performance compares to that top card.
This gives you a clean way to see the gap. If your card sits at 50 percent on that scale, it has about half the graphics power of the strongest current card. If it sits at 80 percent, it is much closer to the top. The number is not a promise of exact frame rates, but it is a fair way to compare cards across generations.
Normalization also helps when new cards arrive. When a faster card takes the top spot, the scale can shift, and older cards move down a little. That is normal, and it is why a calculator needs regular updates. A score from last year may not mean the same thing this year if the top of the scale has changed.
As of late 2026, the card at the top of that scale is the GeForce RTX 5090. It sits at the top of the Tom’s Hardware 2026 GPU hierarchy, with the Radeon RX 9070 XT and the rest of the current range placed below it. That matters for your score, because a card that looked close to the top two years ago sits lower on the scale today, even though the card itself has not changed. Your score can move when the top of the scale moves, and that is normal.
Step 5: CPU Blending Reflects How Games Actually Use a Processor
Games do not use a CPU in one simple way. Some tasks need one fast core, such as game logic and frame preparation. Other tasks can spread across many cores, such as physics, audio, and background work. A good calculator has to reflect both sides.
That is why the tool uses CPU blending. CPU scores combine both single core and multi core benchmark figures to reflect actual gaming behavior. Single core scores show how fast one core can work. Multi core scores show how well the chip can handle many jobs at once. By blending the two, the calculator gives a score that is closer to what you will see in a real game.
This matters a lot when you compare two very different processors. One chip may have fewer cores but faster single core speed, which helps in many games. Another chip may have many cores but slower single core speed, which helps more in streaming and editing. A blended score helps the calculator judge each chip for the workload you actually picked, instead of judging it on one number alone.
Newer chips add one more factor the blended score has to handle: large stacked cache. The Ryzen 7 9800X3D uses second generation 3D V-Cache, which gives it 96MB of L3 cache, and that extra cache helps it in many games even though it has only eight cores. A calculator that looked at core count alone would underrate it. Intel Core Ultra 200S processors take a different path, with performance cores and efficiency cores on one chip, a new LGA1851 socket, and DDR5 memory only. The blended score has to weigh both core types, not just count cores, to judge these chips fairly.
Step 6: User Variables Add Your Resolution and Your Workload
The last step is the one that makes your result personal. The calculator factors in your target monitor resolution and your specific workload type, such as gaming, streaming, or editing.
Resolution changes the balance in a big way. At 1080p, the graphics card has fewer pixels to draw, so it can finish its work faster. That puts more pressure on the CPU to keep up, and a CPU limit is more likely. At 1440p, the card has more work to do, so the balance often shifts. At 4K, the card has far more pixels to draw, so the GPU is almost always the limit, and the CPU usually has spare room. The same CPU and GPU pair can be CPU limited at 1080p and GPU limited at 4K, and both answers can be right.
Workload matters too. Gaming leans on both the CPU and the GPU, but the mix changes by game type. Streaming adds encoding work, which leans more on the CPU or on the GPU encoder, based on your settings. Editing leans more on multi core CPU power, memory, and storage speed. By asking what you do most, the calculator can weigh the factors in a way that fits your real use, not just a generic game test.
Memory and connection speed feed the score too. Current desktop platforms are built around DDR5 memory and PCIe 5.0. Ryzen 9000 processors on the AM5 socket and Intel Core Ultra 200S processors on the LGA1851 socket both use DDR5 only, and both support PCIe 5.0 for the graphics card and for fast NVMe storage. A calculator treats RAM speed and type as part of the CPU side of the score, because slow memory can hold back even a fast processor. PCIe 5.0 itself rarely limits gaming frame rates when a card runs at full x16 width, but the calculator still records the platform, so it can flag a real problem, such as a modern card running in an old, slower slot.
To see how resolution changes the result for your own setup, read our guide to monitor resolution bottlenecks at 1080p, 1440p, and 4K. It explains why the same pair can feel very different at each resolution.
What Your Result Actually Tells You
After the calculator runs through those steps, it gives you a verdict. There are three main verdicts, and each one points to a different next step. Learn them well, because the label matters just as much as the number.
CPU Limited
CPU Limited means your processor is the weak link. It cannot prepare frames fast enough, so your graphics card sits idle and waits. Upgrading your graphics card will not give you more FPS right now, because the new card would still have to wait for the same slow processor.
The signs of a CPU limit are easy to spot once you know them. Your GPU usage stays well below 100 percent, often below 70 or 80 percent, while one or more CPU cores sit near 100 percent. Your frame rate stays flat even when you lower your graphics settings. Your 1 percent low FPS drops sharply, which feels like stutter even when the average FPS looks fine. Open world games, large battles, and busy scenes feel worse than small, quiet scenes.
If you get this result, do not buy a faster GPU first. Check your CPU options, check your RAM speed and amount, and check your background apps. A CPU upgrade, or a fix to a related limit, is the move that will actually help.
GPU Limited
GPU Limited means your graphics card is holding you back. It is working at or near 100 percent, while your CPU has room to spare. A CPU upgrade will not move the needle, because the processor is not the part that is struggling.
This is the most common result, and it is often the healthiest one. A GPU limit is normal for a gaming PC, because the graphics card is supposed to be the part that works hardest when you play. Your frame rate will be steady, but lower than you want at your current settings. If you lower your resolution or your graphics settings, your FPS should rise, because you are giving the card less work to do.
If you get this result, a graphics card upgrade is the move that will help most, if you want higher FPS at the same settings. You can also try free fixes first, such as lowering demanding settings, turning off extra effects, or using upscaling if your game supports it. Those changes will not fix a weak card, but they can make the game feel much smoother while you plan an upgrade.
Balanced
Balanced means both components are well matched. Neither part is waiting on the other in a big way, and you are getting maximum performance out of your money. Your GPU usage will sit high, often near 95 to 100 percent in demanding games, while your CPU has enough headroom to keep feeding it frames.
A balanced result does not mean your PC is perfect for every game at every setting. It means your parts fit each other well at the resolution and workload you picked. You can still want more FPS, but the fix would be a full system upgrade, not a single part swap. If you upgrade only one part in a balanced system, you will create a new imbalance, and the other part will become the new limit.
If you get this result, enjoy it. You do not need to spend money to fix a problem that is not there. Save your budget, tune your settings, and upgrade when you want a real jump in performance across the whole system.
For more real pairings that show each verdict in action, see our real PC bottleneck build examples. Those examples show balanced builds, CPU limited builds, and GPU limited builds side by side.
Your Bottleneck Score Explained
The verdict tells you which side is limited. The score tells you how big the gap is. Together, they give you a clear picture, but only if you read the score the right way.
Our calculator uses four score bands. Each band has a name, a range, and a plain English meaning. Use the table below as your guide.
| Score | Result | What It Means |
|---|---|---|
| 0 to 5 percent | Perfect Match | CPU works great with GPU, no upgrade needed. |
| 6 to 10 percent | Small Limit | Tiny mismatch, completely fine for most PC gaming. |
| 11 to 20 percent | Medium Block | One PC part is working too hard, try changing graphics settings in the game menu. |
| 21 percent or higher | Big Limit | Gaming PC might stutter and freeze, need a hardware upgrade to stop lag. |
0 to 5 Percent: Perfect Match
A score of 0 to 5 percent is a Perfect Match. Your CPU and GPU work great together, and no upgrade is needed to fix balance. This is the result to aim for when you build a new PC or pick a new pairing.
Do not chase a score of 0 percent. A tiny gap is normal, because no two parts are ever a perfect match in every game. A score in this range means the gap is too small to notice in normal play, and your money is better spent elsewhere.
6 to 10 Percent: Small Limit
A score of 6 to 10 percent is a Small Limit. There is a tiny mismatch, but it is completely fine for most PC gaming. You may see a small amount of idle time on the faster part, but you will not feel it in most games.
This is still a good result. You do not need to upgrade to fix it. If you are choosing between two pairings and one scores 4 percent while the other scores 8 percent, pick the one that fits your budget and your other needs. The difference is small, and other factors, such as price, power use, and future upgrade room, matter more.
11 to 20 Percent: Medium Block
A score of 11 to 20 percent is a Medium Block. One PC part is working too hard, and the other part has clear spare room. You may notice it in demanding games, especially in busy scenes or at lower resolutions where the CPU has to work harder.
Before you buy anything, try changing graphics settings in the game menu. If you are GPU limited, lower demanding settings such as shadows, reflections, and ray tracing, and see if your FPS rises. If you are CPU limited, try closing background apps, lowering CPU heavy settings such as crowd density or view distance, and checking that your RAM is running at its rated speed. Those free fixes can make a Medium Block feel much smaller.
If the problem stays after you try the free fixes, plan a targeted upgrade. Replace the weak part, not the strong part, and check the new pairing in the calculator before you buy.
21 Percent or Higher: Big Limit
A score of 21 percent or higher is a Big Limit. Your gaming PC might stutter and freeze, and you need a hardware upgrade to stop lag. This is the range where the imbalance is large enough to hurt real play, not just a number on a screen.
A Big Limit often means one part is far behind the other. It could be a flagship GPU with a budget CPU, or a flagship CPU with an entry level GPU. It could also be a deeper problem, such as very low RAM or a slow drive, which the calculator flags in its wider checks. Do not ignore this result. Check the examples in the next section, find the weak link in your own build, and plan the fix that targets that link first.
A 15 Percent Score Does Not Mean a 15 Percent FPS Drop
This is the most common misunderstanding, so read it carefully. A 15 percent score does not mean FPS will drop by 15 percent. The score is a measure of the gap between your parts, not a direct measure of lost frames.
Real gaming performance changes based on game engine, video settings, and background apps. One game may be very CPU heavy, while another game at the same resolution may be almost all GPU work. One game may run smoothly at 15 percent, while another game with the same score may stutter in busy scenes. Your settings matter too. High settings put more work on the GPU, while low settings put more work on the CPU to feed frames faster.
Use the score as a guide to balance, not as a promise of exact FPS. If you want to know your real FPS, test the games you actually play, at the settings you actually use, and watch your GPU usage and your frame times. The calculator points you to the weak link. Your own testing confirms how much it matters in your games.
Why the Same Pair Can Score Differently
A bottleneck score is not a fixed property of two parts. It changes with context, and that is normal. Here are the main reasons the same CPU and GPU can get a different score on different days, at different settings, or in different games.
Resolution is the biggest factor. As we covered above, a pair that is CPU limited at 1080p can be balanced at 1440p and GPU limited at 4K. That is because higher resolutions add pixels for the GPU to draw, while the CPU work stays much the same. If you change your monitor, recheck your score at the new resolution.
Workload is the next factor. Gaming, streaming, and editing stress different parts of the system. Streaming adds encoding work. Editing adds multi core work and memory work. A pair that is balanced for gaming alone may be CPU limited when you stream at the same time, because the CPU now has two jobs to do at once.
Game engine matters too. Some games are built to use many CPU cores well. Others lean on one or two fast cores. Some games are heavy on shadows and lighting, which load the GPU. Others are heavy on physics and AI, which load the CPU. That is why one game can feel smooth and another can stutter on the same PC.
Settings also shift the balance. High resolution, high texture quality, and ray tracing load the GPU more. Low settings, high frame rate targets, and competitive settings load the CPU more, because the CPU has to prepare more frames per second. Background apps, such as a browser with many tabs, a chat app, or a recording tool, can also steal CPU power and change the result.
Upscaling settings can shift the balance too. DLSS 4 on GeForce RTX 50 series cards can generate up to three extra frames for each frame the card renders, and FSR 4 on Radeon RX 9000 series cards uses machine learning upscaling in supported games. Both features raise the frame rate you see on screen, but they do not change the work your CPU has to do. The processor still has to prepare each real frame, so turning on upscaling can expose a CPU limit that was hidden before. A calculator score is based on rendered performance, not on generated frames, so treat the score as the balance of your real hardware, and treat upscaling as a bonus on top of it.
This is why a calculator asks for resolution and workload, and why it is honest to call the result an estimate. It gives you the most likely balance for the setup you picked, not a single score that fits every game and every setting.
Performance Impact Examples
A score is useful, but examples make it real. The table below shows five common situations, the weak link in each one, and what you will actually see and feel while you play. All five examples come from the source material for this article, and they cover more than just CPU and GPU.
| Build or Situation | Weak Link | What You Will See |
|---|---|---|
| High-end GPU plus Budget CPU, for example RTX 4090 with Intel Core i3-10100 | Processor | Severe stuttering in open world games, GPU usage stays below 50 percent. |
| Flagship CPU plus Entry Level GPU, for example Ryzen 9 with GTX 1650 | Graphics card | Limited to 1080p Low settings in most modern games while CPU remains largely underutilized. |
| Only 8GB RAM in 2026 | System Memory (RAM) | Massive 1 percent low FPS drops, frequent texture streaming issues, occasional Out of Memory game crashes. |
| Poor Case Airflow or Stock CPU Cooler | Thermal (Cooling) | FPS starts high but drops by 30 percent or more after 15 to 20 minutes due to thermal throttling. |
| Gaming on a Mechanical HDD | Storage Drive | 2 to 3 minute loading screens, delayed texture streaming, noticeable pop in while exploring large open world maps. |
High-End GPU Plus Budget CPU
Pairing a card like an RTX 4090 with a processor like an Intel Core i3-10100 is a classic mismatch. The GPU has huge drawing power, but the CPU cannot prepare frames fast enough to use it. In open world games, where the CPU has to handle many objects, AI, and streaming data, the stutter can be severe. GPU usage stays below 50 percent, which is a clear sign that the card is waiting, not working.
The fix here is a CPU upgrade, not a GPU upgrade. A faster processor with more cores and better single core speed will let the GPU do its job, and your FPS will rise even though you did not change the card.
The same pattern shows up with current parts. A GeForce RTX 5090 paired with an old budget processor would show the same low GPU usage and the same stutter, because the limit is the processor, not the card.
Flagship CPU Plus Entry Level GPU
The reverse mismatch is just as clear. A flagship processor like a Ryzen 9 paired with an entry level card like a GTX 1650 leaves the CPU with little to do. The GPU hits its limit fast, so you are limited to 1080p Low settings in most modern games, while the CPU remains largely underutilized.
This build is not broken, but it is unbalanced for modern gaming. The fix is a GPU upgrade. A mid range or higher card will let the CPU show its strength, and you will be able to raise your settings and your resolution without the card holding you back.
Only 8GB RAM in 2026
RAM is often forgotten, but it can be the real limit. Only 8GB RAM in 2026 is tight for modern games, especially when you also run a browser, a chat app, or a stream in the background. The weak link here is System Memory, or RAM.
The signs are clear. You get massive 1 percent low FPS drops, which feel like sudden hitches. You see frequent texture streaming issues, where textures load late or look blurry. You may even get occasional Out of Memory game crashes. A RAM upgrade to 16GB or more, in a dual channel kit, is often one of the cheapest and most effective fixes for this problem.
Poor Case Airflow or Stock CPU Cooler
Cooling is another hidden limit. If your case has poor airflow, or you use a stock CPU cooler that cannot keep up, your parts will heat up during play. When they get too hot, they slow down to protect themselves. This is called thermal throttling.
The pattern is easy to spot. FPS starts high but drops by 30 percent or more after 15 to 20 minutes due to thermal throttling. The game feels fine at first, then gets worse the longer you play. The fix is not a new CPU or GPU. It is better airflow, a better cooler, clean dust filters, and a check that your fans are set up to pull cool air in and push hot air out.
Gaming on a Mechanical HDD
Storage affects how fast your game loads and how fast it can stream new data. Gaming on a mechanical HDD is slow compared to a modern SSD. The weak link here is the Storage Drive.
You will see 2 to 3 minute loading screens, delayed texture streaming, and noticeable pop in while exploring large open world maps. Objects, buildings, and ground textures appear late, which breaks immersion and can even affect play. Moving your games to an SSD is a simple upgrade that fixes loading times and streaming, even if it does not raise your average FPS.
If you recognize your own PC in any of these examples, read our guide to the common signs of a PC bottleneck. It will help you confirm which symptom matches your build, so you can fix the right part first.
Pros and Cons of a Bottleneck Calculator
A bottleneck calculator is a useful tool, but it is not perfect. Here is a fair look at what it does well and where it falls short.
Pros
- Instant bottleneck analysis with no registration required. You pick your parts, you click calculate, and you get a result in seconds.
- Analyzes CPU, GPU, RAM, and screen resolution together. You get a fuller picture than a simple CPU versus GPU check.
- Helps identify which component should be upgraded first. That saves money, because you do not buy a part that will not help.
- Beginner friendly interface. You do not need to know benchmark scores or technical terms to use it.
- Regularly updated to support modern processors and graphics cards, including GeForce RTX 50 series, Radeon RX 9000 series, Ryzen 9000, and Intel Core Ultra 200S parts. New parts are added as they ship, so the tool stays useful.
Cons
- Results are estimated and may differ from real world benchmarks in some games. The calculator uses benchmark data, not a live test on your PC.
- Performance can vary depending on game optimization, graphics settings, and driver versions. A well optimized game and a poorly optimized game will not behave the same way.
- Background applications, temperatures, and system configuration may affect actual FPS and bottleneck results. The calculator cannot see what else is running on your PC, how hot your parts get, or how your system is set up.
Disclaimer: results are estimated performance. Actual gaming performance may vary due to game updates, graphics settings, driver versions, operating system changes, background applications, cooling performance, and other system specific factors.
That disclaimer is not fine print to ignore. It is the honest limit of any calculator. Use the tool to plan, then test in your own games to confirm.
How to Use Your Score to Make a Smart Upgrade Decision
A score is only useful if it leads to a good decision. Follow these steps in order, and you will avoid the most common upgrade mistakes.
Step 1: Run the calculator with your current parts, your real resolution, and your real workload. Write down the verdict and the score. Do not guess your parts. Check your system settings or your purchase list so the input is correct.
Step 2: Check the weak link, not just the number. A 15 percent CPU limit and a 15 percent GPU limit point to very different upgrades. The label tells you which part to fix.
Step 3: Try the free fixes first. Close background apps. Update your drivers. Check that your RAM is running at its rated speed. Clean dust from your case and check your fan setup. Lower the settings that load the weak part most. If you have a Medium Block, these fixes may be enough.
Step 4: Test in your own games. Play the games you care about most, at the settings you use most, and watch GPU usage and frame times if you can. If GPU usage is low and CPU usage is high, the CPU limit is real. If GPU usage is near 100 percent, the GPU limit is real. Your own test is the best proof.
Step 5: Check the upgrade in the calculator before you buy. Enter the new part with your other parts still in place, and see if the score improves. If it does not improve much, that upgrade is not the right move yet. Check the other part instead.
Step 6: Buy the weak part first, then recheck. After you install the new part, run the calculator again with your new setup. You should see a better balance. If a new limit appears, you will know what to plan for next, but you do not need to fix it right away if your games now run well.
Step 7: Do not chase a perfect score. A Small Limit is fine. A Perfect Match is great, but spending a lot of money to move from 7 percent to 3 percent will not change how your games feel. Spend on the upgrade that gives you a real, visible improvement.
For a full step by step fix guide, read how to fix a CPU GPU bottleneck. It walks through the same process with more detail on settings, drivers, and upgrades.
What a Bottleneck Calculator Cannot Tell You
A good tool is honest about its limits. A bottleneck calculator cannot tell you everything, and knowing those limits will help you use it well.
It cannot measure your own PC. It does not run a game, it does not read your GPU usage, and it does not check your temperatures. It works from benchmark data for the parts you select, not from live readings on your machine.
It cannot predict every game. Game engines differ, patches change performance, and new games can stress parts in new ways. A score that fits one game well may fit another game less well.
It cannot see your drivers, your BIOS settings, or your background apps. An old driver, a wrong BIOS setting, or a heavy background app can change real performance a lot, and none of those show up in the calculator input.
It cannot see your cooling or your power supply. A hot CPU will throttle, a hot GPU will throttle, and a weak power supply can limit boost speeds. Those are real limits, but they are outside the calculator.
It cannot promise exact FPS. It gives you a balance estimate, not a frame rate guarantee. Use it to find the weak link and to plan, then confirm with real testing in your games.
It cannot tell you how much upscaling will help in your games. DLSS 4 and FSR 4 work only in supported games, and only on GeForce RTX 50 series and Radeon RX 9000 series cards, so the boost you get depends on the game you play and the card you own.
When you keep those limits in mind, the calculator becomes much more useful. You will trust it for what it does well, which is spotting mismatches and guiding upgrades, and you will not blame it for what it was never meant to do.
Frequently Asked Questions
How does a bottleneck calculator work?
A bottleneck calculator compares your CPU and GPU using benchmark data from trusted sources, then checks factors such as clock speed, core count, IPC, memory bandwidth, memory latency, and GPU compute capacity. It normalizes GPU scores against the strongest current card, blends single core and multi core CPU scores, and factors in your resolution and workload. The result names the limiting part and gives a percentage gap between the two sides.
What does a bottleneck percentage mean?
A bottleneck percentage is the size of the gap between your CPU and GPU for the setup you picked. A low percentage means the parts are close in performance. A high percentage means one part is much stronger than the other, and the stronger part has to wait. It is a balance score, not a direct FPS loss figure. A 15 percent score does not mean your FPS will drop by 15 percent.
What is a good bottleneck percentage?
A good bottleneck percentage is 0 to 10 percent. A score of 0 to 5 percent is a Perfect Match, and a score of 6 to 10 percent is a Small Limit that is completely fine for most PC gaming. A score of 11 to 20 percent is a Medium Block that is worth checking, and a score of 21 percent or higher is a Big Limit that likely needs a hardware fix.
Is a GPU bottleneck bad?
No, a GPU bottleneck is usually normal and healthy for a gaming PC. It means your graphics card is working at or near 100 percent while your CPU has room to spare. You can trade settings or resolution for more frames at any time. A CPU bottleneck is harder to work around, because lowering graphics settings does not help the processor keep up.
Can a bottleneck calculator be wrong?
Yes, it can be off, because it gives an estimate, not a live measurement. Real performance changes with the game engine, graphics settings, driver versions, background apps, cooling, and system setup. The calculator is best at spotting a clear mismatch, such as a flagship part paired with a budget part. It is less exact at predicting small differences between two close pairings.
Should I upgrade my CPU or GPU first?
Upgrade the part the calculator names as the weak link. If the result is CPU Limited, upgrade the CPU first, because a new GPU will still have to wait for the same processor. If the result is GPU Limited, upgrade the GPU first, because a new CPU will not help a card that is already maxed out. If the result is Balanced, do not upgrade one part alone, because you will create a new imbalance.
Does RAM affect a bottleneck score?
Yes, RAM can affect real performance even when the main score focuses on CPU and GPU. Only 8GB RAM in 2026 can cause big 1 percent low FPS drops, texture streaming issues, and Out of Memory crashes. Slow RAM or single channel RAM can also hold back a CPU. Check your RAM amount and speed as part of any bottleneck check, and consider a dual channel kit if your system is still on a single stick or a low amount.
Why does my score change at 1080p, 1440p, and 4K?
Your score changes because resolution changes how hard the GPU has to work. At 1080p the GPU has fewer pixels to draw, so it finishes faster and the CPU is more likely to be the limit. At 1440p the GPU has more work, so the balance often improves. At 4K the GPU has far more pixels to draw, so it is almost always the limit. Always run the calculator at the resolution you actually play at.
How do DLSS 4 and FSR 4 affect my bottleneck score?
They do not change the score itself, because the calculator measures the balance of your real hardware. DLSS 4 on GeForce RTX 50 series cards and FSR 4 on Radeon RX 9000 series cards raise the frame rate you see by upscaling or generating extra frames, but your CPU still has to prepare each real frame. Upscaling can make a GPU limit feel smaller, and it can expose a CPU limit, but it does not fix an unbalanced pairing. Use the score to judge your hardware, and use upscaling as a free performance boost on top.
Conclusion
A bottleneck calculator is a simple tool with a clear job. It compares your CPU and GPU against benchmark data, it weighs factors such as clock speed, core count, IPC, memory bandwidth, memory latency, and GPU compute capacity, it normalizes GPU scores and blends CPU scores, and it factors in your resolution and workload. Then it tells you which part is the limit, and how big the gap is.
Your score is a guide, not a verdict on your whole PC. A score of 0 to 5 percent is a Perfect Match. A score of 6 to 10 percent is a Small Limit and fine for most gaming. A score of 11 to 20 percent is a Medium Block, so try your settings first. A score of 21 percent or higher is a Big Limit, so plan a hardware upgrade for the weak part.
Remember the key point. A 15 percent score does not mean FPS will drop by 15 percent. Real performance depends on your game, your settings, your drivers, and your system. Use the calculator to find the weak link, try the free fixes, test in your own games, and upgrade the right part first.
If your result is Balanced, enjoy it and do not spend money to fix a problem that is not there. If your result is CPU Limited or GPU Limited, you now know what that label means and what to do next. Run your own parts through the tool on our homepage today, and make your next upgrade a smart one.

Leave a Reply